Welcome to our blog, where we delve into the fascinating world of technical analysis in forex trading! If you’re new to forex or looking to enhance your trading strategies, understanding technical analysis is crucial. Let’s explore what technical analysis is and how it can empower you to make informed trading decisions.
What is Technical Analysis?
Technical analysis is a method of evaluating financial markets, including forex, by analyzing historical price data and market statistics. Unlike fundamental analysis, which focuses on economic and financial factors, technical analysis relies on chart patterns, price movements, and various technical indicators to predict future price movements.
The underlying principle of technical analysis is that market prices reflect all available information, including past market behavior and the impact of economic events. By analyzing price patterns and indicators, traders aim to identify trends, potential reversals, and entry and exit points for their trades.

Key Concepts in Technical Analysis:
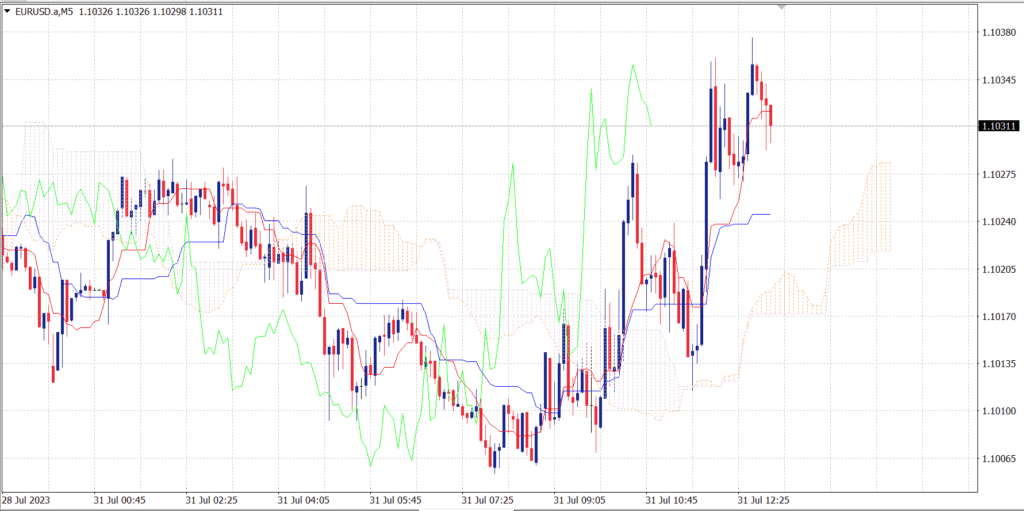
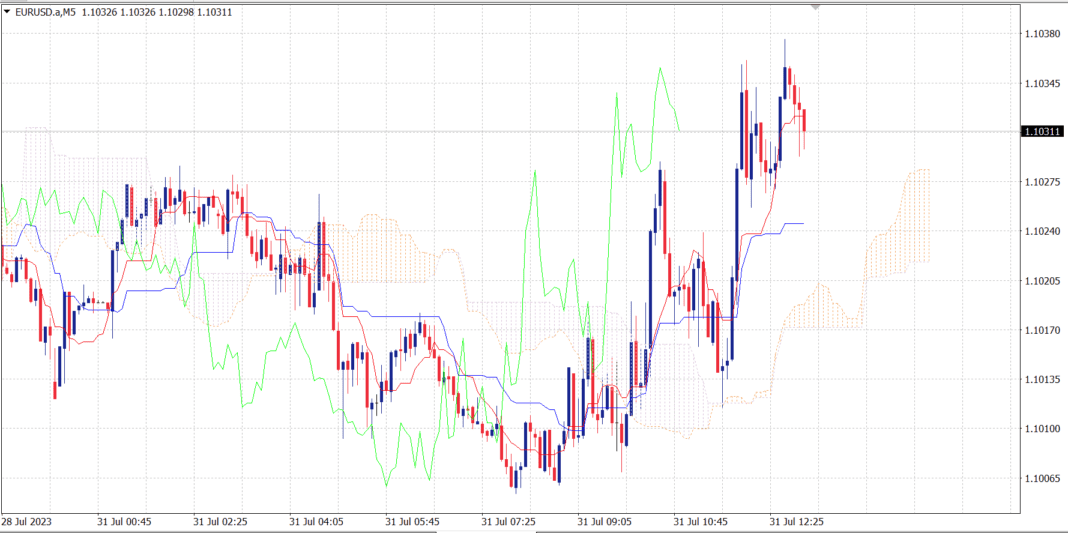
- Price Charts: Price charts are the foundation of technical analysis. The most common types of charts are line charts, bar charts, and candlestick charts. Candlestick charts are especially popular as they provide valuable information about price movements, including open, high, low, and close prices for a specific period.
- Trends: Identifying trends is crucial in technical analysis. A trend is the general direction in which a currency pair’s price is moving. Trends can be upward (bullish), downward (bearish), or sideways (consolidating).
- Support and Resistance: Support levels are price levels where a currency pair tends to find buying interest, preventing it from falling further. Resistance levels, on the other hand, are price levels where selling pressure tends to halt upward price movements. These levels help traders identify potential entry and exit points.
- Technical Indicators: Technical indicators are mathematical calculations based on historical price and volume data. Examples include Moving Averages (MA), Relative Strength Index (RSI), Moving Average Convergence Divergence (MACD), and Bollinger Bands. Traders use indicators to gain insights into market conditions and potential trading opportunities.
- Chart Patterns: Chart patterns are specific formations on price charts that can indicate potential market reversals or continuations. Examples include head and shoulders, double tops/bottoms, and triangles.
How to Apply Technical Analysis in Forex Trading:
- Identify Trends: Start by identifying the primary trend of the currency pair you want to trade. Use higher timeframes for long-term trends and lower timeframes for shorter-term trends.
- Spotting Support and Resistance: Locate key support and resistance levels on your price charts. These levels can act as potential turning points for price movements.
- Using Technical Indicators: Combine technical indicators with price analysis to confirm potential trade setups. Avoid overloading your charts with too many indicators to prevent confusion.
- Chart Patterns and Candlestick Analysis: Learn to recognize chart patterns and candlestick formations. These patterns can provide valuable insights into potential market reversals or continuation patterns.
- Risk Management: Always implement proper risk management strategies, including setting stop-loss and take-profit levels. This helps protect your capital and minimize losses in volatile markets.
Final Thoughts:
Technical analysis is a powerful tool that can significantly enhance your forex trading skills. Remember, no analysis method guarantees 100% accuracy, but technical analysis can provide valuable information and increase your probabilities of successful trades.
Stay patient and keep learning. Practice on demo accounts before using real money, and always stay disciplined in executing your trading plans. By mastering technical analysis, you’ll be well on your way to becoming a confident and successful forex trader! Happy trading!

