
Chart patterns are the secret language of the financial markets, offering traders invaluable insights into potential price movements. These patterns are formed as a result of the ebb and flow of buying and selling pressure, providing traders with essential tools for identifying trends, reversals, and entry points. In this comprehensive guide, we’ll explore the top 10 chart patterns that every trader should have in their toolbox.
Reversal Patterns
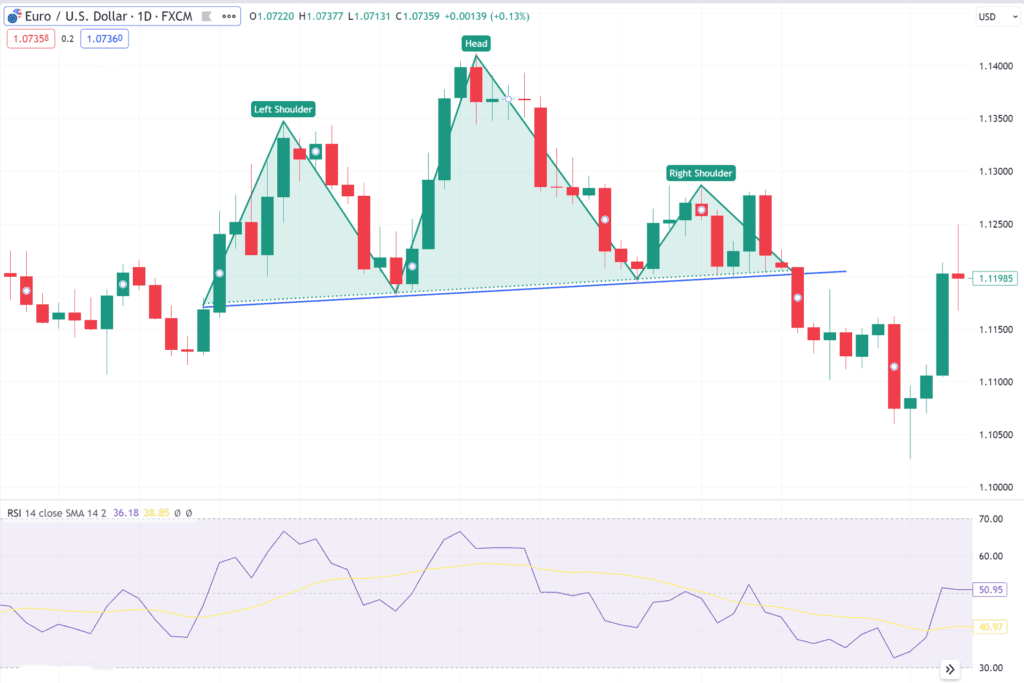
- Head and Shoulders
The Head and Shoulders pattern is a reliable reversal indicator characterized by three swing highs, with the middle peak being the highest. This pattern suggests a trend change is imminent. A break below the neckline is a sell signal, with the price target calculated from the head’s top to the neckline.
- Double Top and Double Bottom.
Double Top and Double Bottom patterns are reversal patterns that form during uptrends and downtrends, respectively. A Double Top signifies that buyers failed to push the price higher, while a Double Bottom signals a lack of selling pressure to drive prices lower. Breaks of support or resistance lines trigger trade entries.
- Triple Top and Triple Bottom
Similar to Double patterns, Triple Tops and Triple Bottoms offer more confirmation. These patterns have three swing highs or lows, respectively, and provide stronger signals when support or resistance lines are breached.
- Rounding Top and Rounding Bottom
Rounding Top and Rounding Bottom patterns signify gradual shifts in sentiment. A Rounding Top indicates a shift from bullish to bearish sentiment, while a Rounding Bottom reflects a shift from bearish to bullish. Entry points are triggered when support or resistance lines are broken.
Continuation Patterns
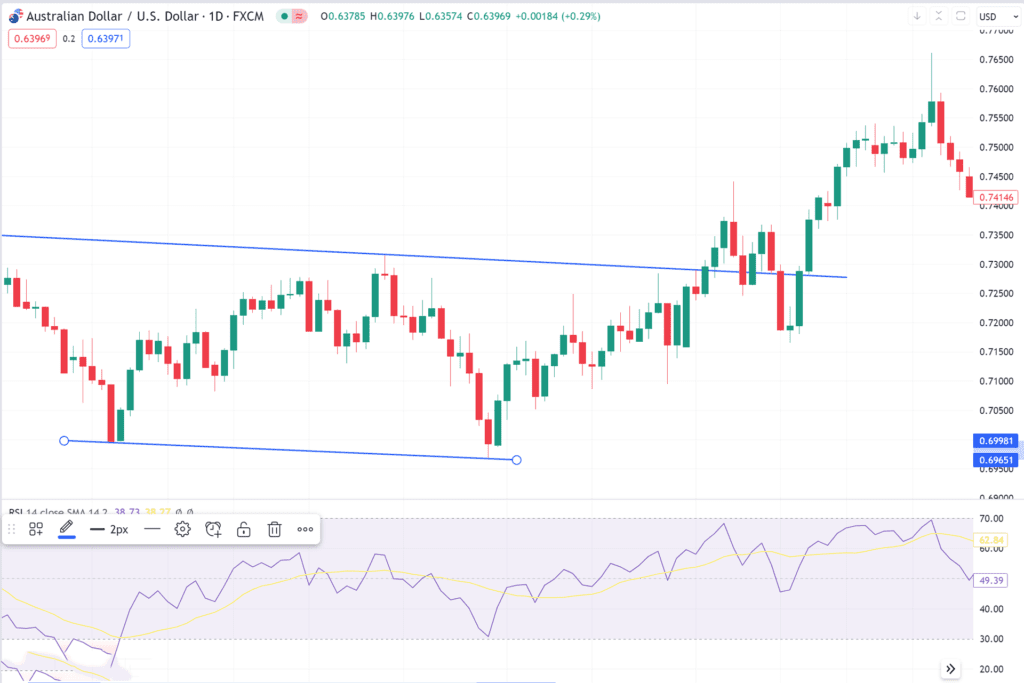
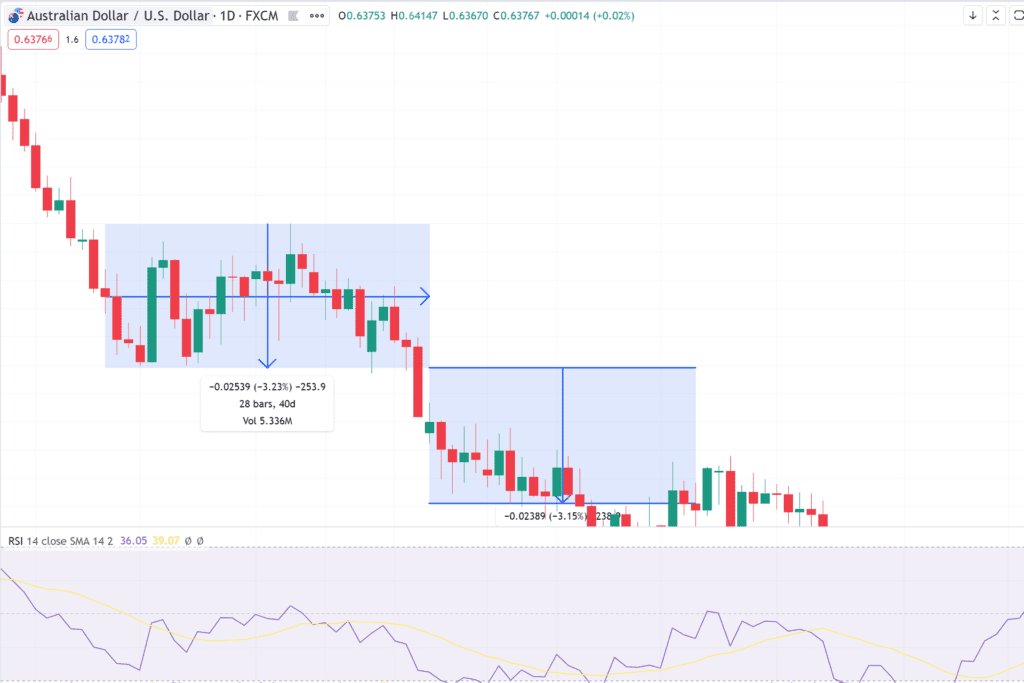
- Rectangles
Rectangles are continuation patterns that confirm the prevailing trend’s persistence. Bullish rectangles occur during uptrends, with price consolidation within horizontal lines. A breakout above indicates an uptrend continuation. Conversely, bearish rectangles form during downtrends, signaling a potential continuation when the price breaks below.
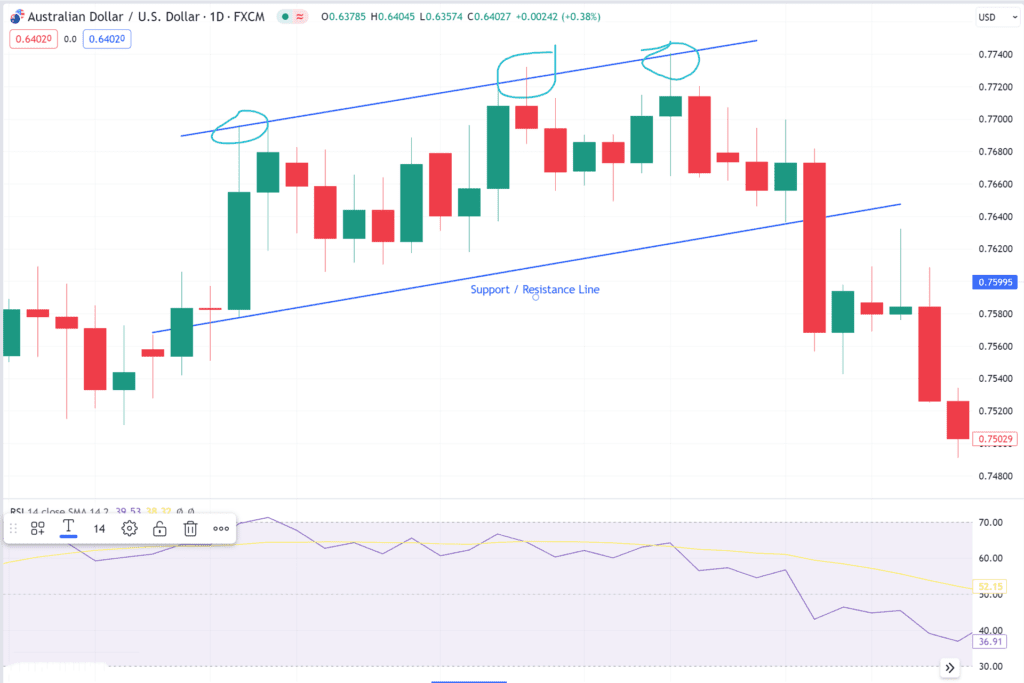
- Wedges
Wedges are continuation patterns characterized by converging trendlines. A bullish wedge in an uptrend implies temporary seller pressure, resolved with a breakout above the upper trendline. A bearish wedge in a downtrend suggests temporary buyer pressure, resolved with a breakout below the lower trendline.
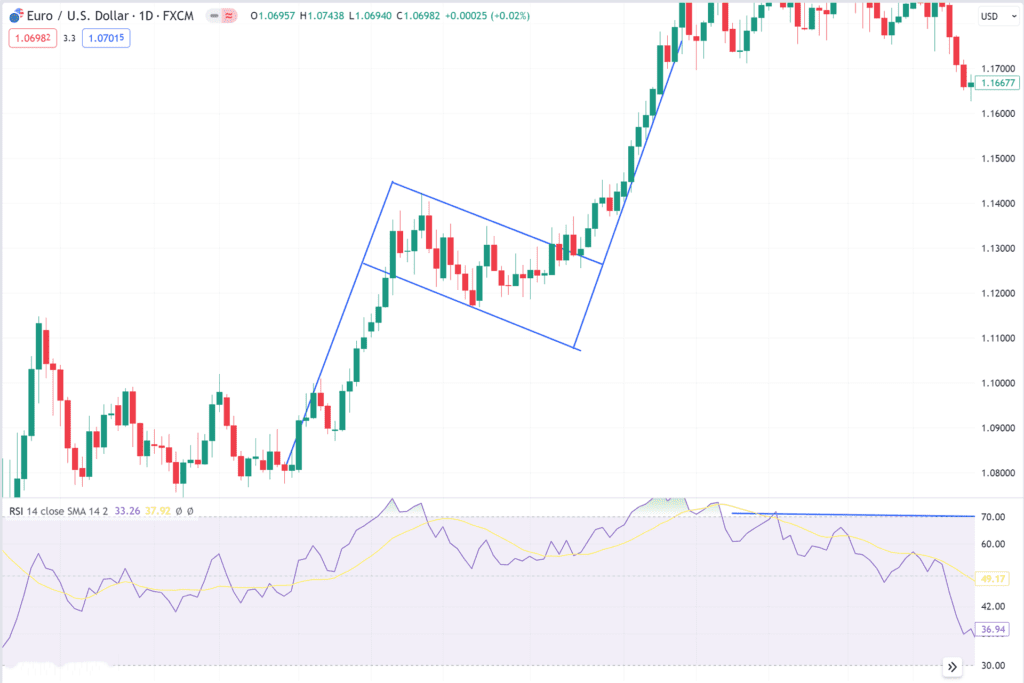
- Flags
Flags, akin to wedges, have parallel trendlines. A bullish flag in an uptrend suggests a short-term consolidation before the upward move resumes. Conversely, a bearish flag in a downtrend indicates a temporary pause before the downtrend resumes.
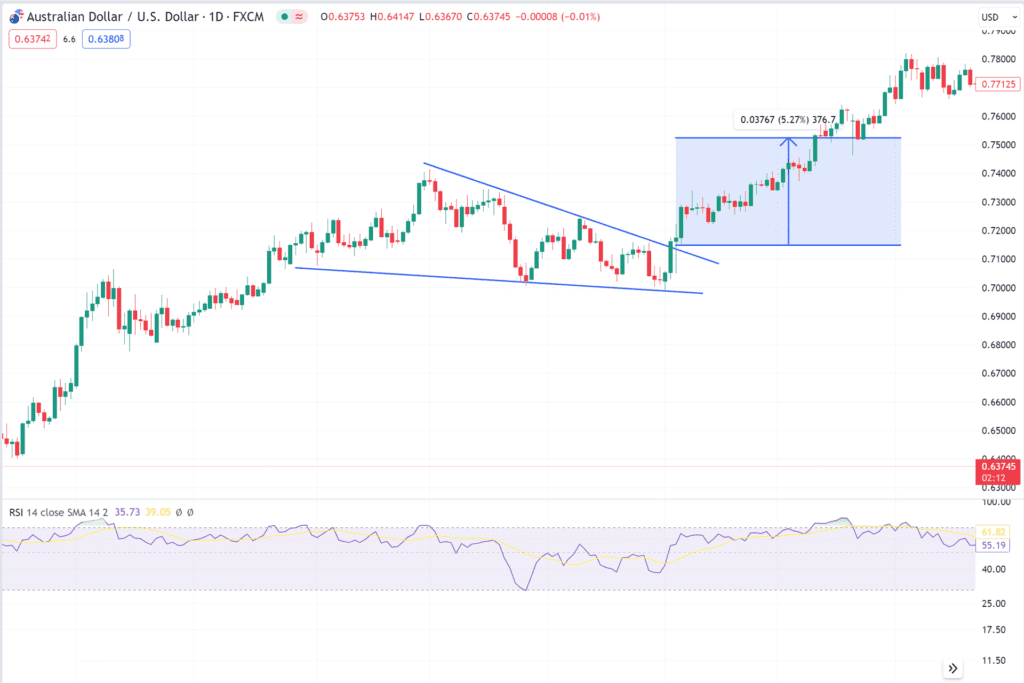
- Triangles (Ascending, Descending, and Symmetrical)
Triangles can be ascending, descending, or symmetrical, depending on their trendlines’ slopes. Ascending triangles during uptrends and descending triangles during downtrends suggest breakouts in the trend’s direction. Symmetrical triangles can indicate either a continuation or reversal, with breakouts serving as entry points.
- Cup and Handle
The Cup and Handle is a continuation pattern that blends elements of a Rounding Top and Pullback (Handle). In an uptrend, it indicates a shift from bearish to bullish sentiment, with a pullback before a breakout. In a downtrend, the inverse pattern applies, and entry points occur after breakout.
Conclusion
Mastering chart patterns is a valuable skill for traders seeking to navigate the dynamic world of financial markets. While these patterns provide insights, they should be used in conjunction with other indicators and a solid trading strategy. Remember that no single tool guarantees success, but understanding these top chart patterns equips you with a powerful set of tools for making informed trading decisions. Find what works for you, and always approach trading with caution and discipline.
Foundations include head-and-shoulders, double top/bottom, triangles and flags. They signal continuation or reversal when confirmed by volume and trend.
Yes—patterns are price behaviour, not market-specific. Crypto’s volatility just demands wider stops and stricter confirmation.
Risk Warning & Disclosure: Trading forex, CFDs and cryptocurrencies carries high risk and may not be suitable for all investors. You could lose more than your initial deposit. This article is for general information only and is not financial advice. Forex Daily may receive commission from brokers (including PIP Affiliates) when you sign up via our links, at no extra cost to you. Always trade with capital you can afford to lose.


")