Thursday, November 21, 2024
HomeLean ForexTechnical Analysis: Understanding Divergence

Technical Analysis: Understanding Divergence

- Advertisement -

Divergence, a powerful concept in the realm of technical analysis, serves as a strategic compass for traders seeking to navigate the complex terrain of financial markets. It’s a tool that unveils hidden nuances within price movements, shedding light on potential trend reversals or extensions. Understanding divergence is akin to deciphering the language of the markets, where subtle cues can make all the difference in making successful trading decisions.

At its core, divergence is a reflection of the tug-of-war between price action and a chosen technical indicator. It comes into play when these two essential components of market analysis move out of sync. In essence, it’s a battle of momentum, and spotting this discordance can be a game-changer for traders.
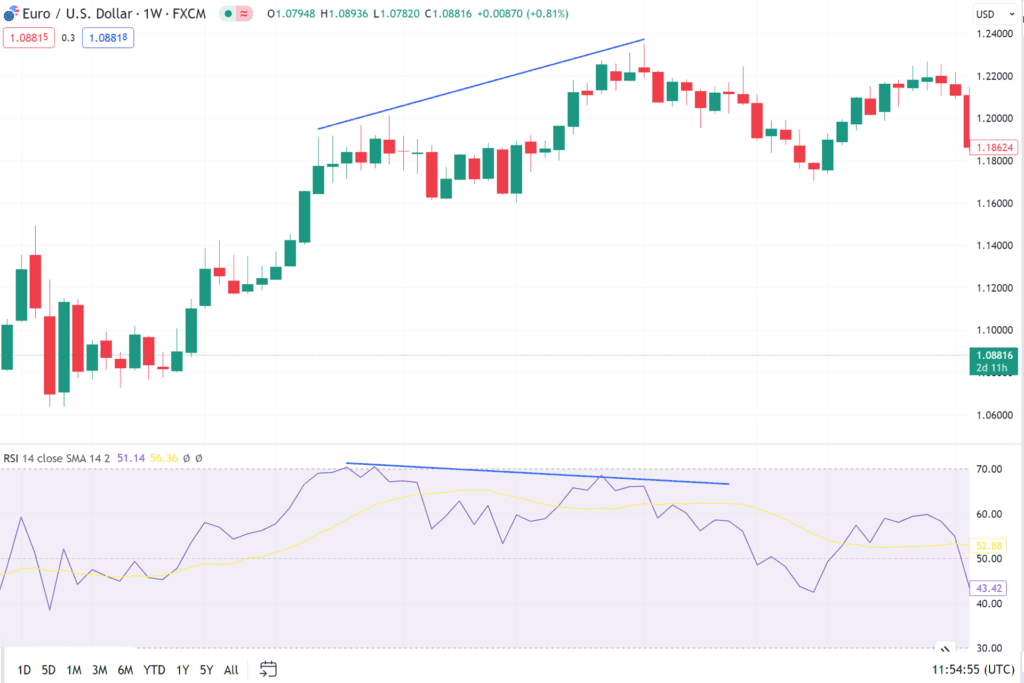
bearish (negative)
Bearish (negative) Divergence

The Basics of Divergence

Picture this: You’re analyzing a stock, currency pair, or any tradable asset on your charting platform. As you scrutinize the price movements, you’re also keeping an eye on a selected technical indicator, like the Relative Strength Index (RSI) or the Moving Average Convergence Divergence (MACD). This indicator serves as your compass, guiding you through the market’s twists and turns.

However, the magic of divergence happens when this guiding compass starts to disagree with the price action. Here’s how it plays out:

  1. Bearish (Negative) Divergence: This scenario unfolds when the price of the asset reaches new highs, suggesting an uptrend, but your chosen indicator fails to mirror this enthusiasm. Instead, it either flattens out or starts to trend downwards. This divergence implies that the bullish momentum may be waning, and a potential trend reversal or correction could be on the horizon.
  2. Bullish (Positive) Divergence: Conversely, bullish divergence materializes when the price hits new lows, indicating a potential downtrend. Yet, your indicator refuses to follow suit and starts showing higher readings. In this case, it suggests that despite the prevailing bearish sentiment, there’s an underlying strength building up, hinting at a possible trend reversal to the upside.

The Power of Hidden Divergence

Now, while regular divergence can be a potent signal on its own, hidden divergence adds another layer of complexity and insight to the mix. Hidden divergence occurs when the price and your chosen indicator move in opposite directions but align with the prevailing trend. Let’s explore this concept further:

  1. Bullish (Positive) Hidden Divergence: In the midst of an uptrend, you might notice that the price retraces slightly, forming a higher low. At the same time, your indicator dips and creates a lower low. This hidden divergence suggests that, although there’s a temporary pullback in price, the overall bullish trend remains robust, potentially providing an opportunity to enter or stay in a long trade.
  2. Bearish (Negative) Hidden Divergence: Conversely, during a downtrend, you may observe the price attempting a minor recovery, forming a lower high. Simultaneously, your indicator starts climbing, recording a higher high. This hidden bearish divergence signifies that despite the temporary upward move, the underlying bearish pressure is still dominant, hinting at the potential continuation of the downtrend.

The Art of Divergence Trading

Traders harness divergence as a tool to make more informed decisions. It’s a means of looking beneath the surface of price action to gauge the strength of market sentiment. However, like any tool in trading, it should be used judiciously and in conjunction with other forms of analysis.

When identifying divergence, it’s essential to validate your observations with other technical indicators, trendlines, or support and resistance levels. This multi-faceted approach helps filter out false signals and enhances the reliability of your trading decisions.

In conclusion, divergence is more than just a concept in technical analysis; it’s a dynamic and actionable tool that traders employ to gain insights into the intricate dance of market forces. It’s a reminder that beneath the surface of price charts lies a world of hidden information, waiting for those who have the skills to decode it.

- Advertisement -

- A word from our sponsors -

Most Popular

More from Author

Weekly Report (July 22nd – 26th, 2024)

Last week’s focus was on equity indices, looking for signs of...

Weekly Report (June 17th – 21st, 2024)

Another lively week came to a close, with some of the...

Dangerous Trading Methods in Forex Trading

Forex trading can be a lucrative endeavor, but it also carries...

Why It Is Easier to Lose Than Win in Forex Trading

Forex trading is often portrayed as a fast track to financial...

- A word from our sponsors -

Read Now

Weekly Report (July 22nd – 26th, 2024)

Last week’s focus was on equity indices, looking for signs of stabilization following the previous week’s strong sell-off. Global economic data remains mixed, and the US PCE inflation reading came in flat as expected.Currency MarketsUS Dollar (USD)The US Dollar continued to underperform, closing the week flat even...

Weekly Report (June 17th – 21st, 2024)

Another lively week came to a close, with some of the main trends from recent months continuing. Equity markets moved higher but are starting to show signs of fatigue. The Swiss National Bank (SNB) surprised by cutting rates again, while the Bank of England (BoE) and the...

Dangerous Trading Methods in Forex Trading

Forex trading can be a lucrative endeavor, but it also carries significant risks. Some trading methods, if not managed properly, can be particularly dangerous and lead to substantial losses. Here, we will explore several risky trading strategies that traders should approach with caution.1. Martingale StrategyDescriptionThe Martingale strategy...

Why It Is Easier to Lose Than Win in Forex Trading

Forex trading is often portrayed as a fast track to financial freedom, but the reality is that the majority of traders end up losing money rather than making it. Several factors contribute to this outcome, making it easier to lose than to win in the highly competitive...

Signal Subscription: Boost Your Trading Performance

In the fast-paced world of forex trading, staying ahead of market movements and making informed decisions is crucial for success. One effective way to enhance your trading strategy and improve your chances of profitability is by subscribing to a signal service. Signal subscriptions provide traders with valuable...

Why Is The Price Of Gold Rising?

Gold has been on a notable upward trajectory recently, with a combination of factors driving prices close to historical highs. Over the past six months, gold prices have climbed approximately 20%, reaching over $2,400 per ounce, approaching the all-time high.Key Catalysts for Rising Gold PricesInterest Rate Expectations:A...

Weekly Market Report: May 13th – 17th, 2024

Markets Surge on Weak US CPI DataThe past week saw a robust rally across various markets, spurred by marginally weak US CPI data reported on Wednesday. Equities and cryptocurrencies performed well, with a significant spotlight on precious metals and copper, which saw explosive growth.Key Highlights:US Dollar Decline:The...

Insights for Traders Amid Ukraine Developments

In the realm of trading, geopolitical events like the recent developments in Ukraine, as outlined by President Zelensky on February 17th, can significantly impact financial markets. Zelensky's decision to withdraw from Avdiivka underscores the importance of staying informed about global conflicts, as they can affect the demand...

Weekly Market Report: January 22nd – 26th, 2024

Key Market Movements in the SpotlightAs we conclude another eventful week in the financial landscape, the prevailing trend of the year remains evident. Equities continue to thrive, driven by widespread expectations of central bank rate cuts throughout 2024.Highlights:US Dollar Sees Modest Gain:The US Dollar experienced a slight...

Market Insights: Reviewing the First Week of 2024

As the financial markets resumed action after the holiday season, the arrival of 2024 introduced intriguing movements, hinting at potential shifts in established trends. Join us for a comprehensive analysis in our weekly newsletter!Noteworthy Market Trends:US Dollar's Vigorous Start:The US Dollar commenced the year on a robust...

Market Insights: Weekly Overview (December 11th – 15th, 2023)

Last week witnessed significant market shifts, largely steered by central bank actions. Among the surprises was the Norges Bank rate hike, but it was the Federal Reserve's dovish stance that notably impacted market sentiments.USD Takes a Dive:The US Dollar retraced all gains from the prior week, driven...

Unveiling the Dynamics of Trading Firms: Pioneers in Financial Markets

Trading firms operate at the heart of global financial markets, executing transactions and playing a pivotal role in shaping market dynamics. These entities, ranging from small proprietary trading shops to large hedge funds, wield significant influence. Let's delve into the multifaceted world of trading firms, exploring their...