Thursday, March 19, 2026
HomeLean ForexTechnical Analysis: Understanding Divergence

Technical Analysis: Understanding Divergence

- Advertisement -

Divergence, a powerful concept in the realm of technical analysis, serves as a strategic compass for traders seeking to navigate the complex terrain of financial markets. It’s a tool that unveils hidden nuances within price movements, shedding light on potential trend reversals or extensions. Understanding divergence is akin to deciphering the language of the markets, where subtle cues can make all the difference in making successful trading decisions.

At its core, divergence is a reflection of the tug-of-war between price action and a chosen technical indicator. It comes into play when these two essential components of market analysis move out of sync. In essence, it’s a battle of momentum, and spotting this discordance can be a game-changer for traders.

bearish (negative)
Bearish (negative) Divergence

The Basics of Divergence

Picture this: You’re analyzing a stock, currency pair, or any tradable asset on your charting platform. As you scrutinize the price movements, you’re also keeping an eye on a selected technical indicator, like the Relative Strength Index (RSI) or the Moving Average Convergence Divergence (MACD). This indicator serves as your compass, guiding you through the market’s twists and turns.

However, the magic of divergence happens when this guiding compass starts to disagree with the price action. Here’s how it plays out:

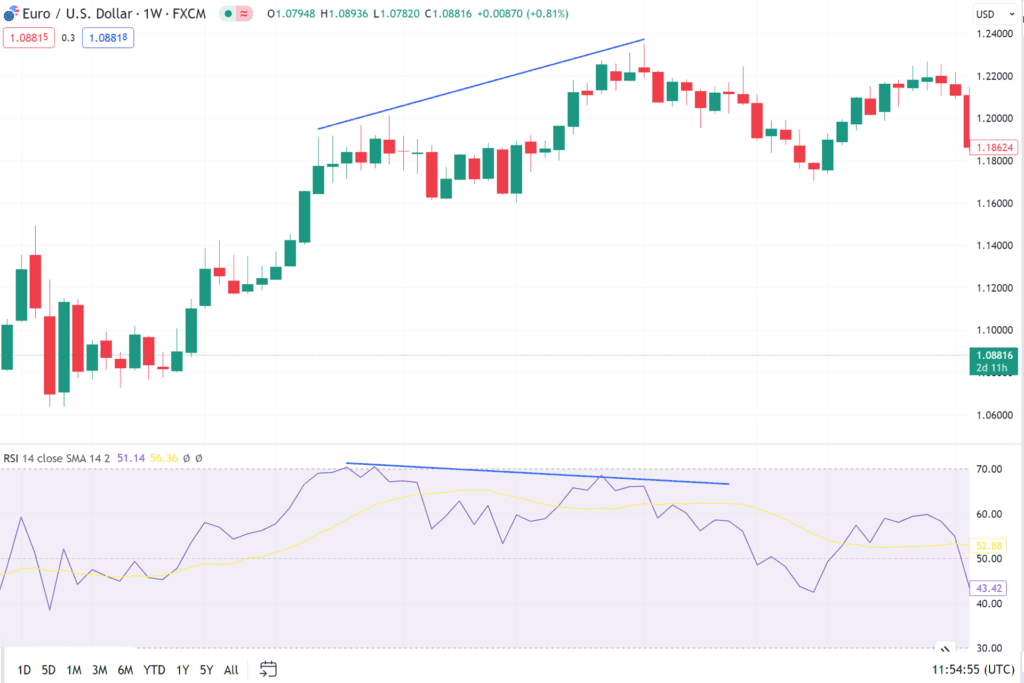
  1. Bearish (Negative) Divergence: This scenario unfolds when the price of the asset reaches new highs, suggesting an uptrend, but your chosen indicator fails to mirror this enthusiasm. Instead, it either flattens out or starts to trend downwards. This divergence implies that the bullish momentum may be waning, and a potential trend reversal or correction could be on the horizon.
  2. Bullish (Positive) Divergence: Conversely, bullish divergence materializes when the price hits new lows, indicating a potential downtrend. Yet, your indicator refuses to follow suit and starts showing higher readings. In this case, it suggests that despite the prevailing bearish sentiment, there’s an underlying strength building up, hinting at a possible trend reversal to the upside.

The Power of Hidden Divergence

Now, while regular divergence can be a potent signal on its own, hidden divergence adds another layer of complexity and insight to the mix. Hidden divergence occurs when the price and your chosen indicator move in opposite directions but align with the prevailing trend. Let’s explore this concept further:

  1. Bullish (Positive) Hidden Divergence: In the midst of an uptrend, you might notice that the price retraces slightly, forming a higher low. At the same time, your indicator dips and creates a lower low. This hidden divergence suggests that, although there’s a temporary pullback in price, the overall bullish trend remains robust, potentially providing an opportunity to enter or stay in a long trade.
  2. Bearish (Negative) Hidden Divergence: Conversely, during a downtrend, you may observe the price attempting a minor recovery, forming a lower high. Simultaneously, your indicator starts climbing, recording a higher high. This hidden bearish divergence signifies that despite the temporary upward move, the underlying bearish pressure is still dominant, hinting at the potential continuation of the downtrend.

The Art of Divergence Trading

Traders harness divergence as a tool to make more informed decisions. It’s a means of looking beneath the surface of price action to gauge the strength of market sentiment. However, like any tool in trading, it should be used judiciously and in conjunction with other forms of analysis.

When identifying divergence, it’s essential to validate your observations with other technical indicators, trendlines, or support and resistance levels. This multi-faceted approach helps filter out false signals and enhances the reliability of your trading decisions.

In conclusion, divergence is more than just a concept in technical analysis; it’s a dynamic and actionable tool that traders employ to gain insights into the intricate dance of market forces. It’s a reminder that beneath the surface of price charts lies a world of hidden information, waiting for those who have the skills to decode it.

- Advertisement -

- A word from our sponsors -

Most Popular

More from Author

Why Gold Dropped Significantly Amid Global Market Turmoil

Understanding the Recent Gold Market Shake-UpHave you noticed how gold prices...

2026 Market Highlights: What You Need to Know About Today’s Trends

Welcome to Your Daily Market SnapshotHey there! We all know how...

Boost Your Social Media Engagement: Tips for Sharing Content Effectively

Connecting with Your Audience Through Shared ContentHave you ever wondered why...

Market Quick Insights: Oil, USD, and Gold Trends Next Week

Hey traders, let’s talk about what’s coming up in the market!Ever...

- A word from our sponsors -

Read Now

Why Gold Dropped Significantly Amid Global Market Turmoil

Understanding the Recent Gold Market Shake-UpHave you noticed how gold prices suddenly took a nosedive last Wednesday? It might seem surprising, especially since many of us turn to gold as a safe haven during turbulent times. But the recent sharp drop is tied to a mix of...

2026 Market Highlights: What You Need to Know About Today’s Trends

Welcome to Your Daily Market SnapshotHey there! We all know how overwhelming it can be trying to keep up with the rapid changes in the global market. Today, I want to share some of the most recent and important updates that can help you better understand what’s...

Boost Your Social Media Engagement: Tips for Sharing Content Effectively

Connecting with Your Audience Through Shared ContentHave you ever wondered why some posts just seem to resonate instantly with your followers? Sharing content that aligns with your audience’s interests can make a huge difference. Think of it as having a friendly chat—when you share stories or images...

Market Quick Insights: Oil, USD, and Gold Trends Next Week

Hey traders, let’s talk about what’s coming up in the market!Ever felt like the market is throwing surprises left and right? Sometimes, just a small news item or geopolitical tension can shake things up significantly. Recently, after market hours, a hot spot emerged at Kharg Island, Iran’s...

EUR/USD Outlook Next Week: Key Trends & Tips to Stay Ahead

Understanding Next Week’s EUR/USD Market OutlookHey there! If you're like many traders, you might be feeling a bit overwhelmed by the constant swings in the EUR/USD pair. Recently, the US dollar's strength has been a dominant force, influencing market movements across the globe. Knowing what might happen...

Understanding the Rising Tensions in the Middle East: What You Need to Know

Introduction: Why Should You Care About Middle East Tensions?Have you noticed the recent headlines about conflicts in the Middle East? It can feel overwhelming, especially when news reports seem complex and detached from daily life. But understanding these developments is important because they can impact the global...

How Rising Energy Prices and Global Tensions Impact Forex & Investment Strategies

Feeling Overwhelmed By Changing Energy Markets?If you’ve been following the news lately, you might notice how energy prices are making headlines — and not in a good way. It’s like watching a storm brewing, with escalations between countries and rising fuel costs threatening to shake up markets...

Understanding Global Tensions: US Missile Strikes, Oil Prices & Tax Claims

Hey there, let’s get real about recent world eventsEver find yourself overwhelmed by the constant barrage of news? You're not alone. Today, let's unpack some recent headlines that might seem complicated but truly impact us all—think of this as catching up over coffee.US missile strikes in Iran:...

How Geopolitical Tensions Impact Gold and Oil Prices Today

Understanding the Market Reactions to Geopolitical TensionsHave you noticed how markets tend to react sharply whenever tensions rise between major countries? Recently, the escalation between the US, Israel, and Iran has ruffled global financial waters. It’s like watching a storm brewing, with gold and oil prices jumping...

Oil Prices Surge: What It Means for Aussies and Your Wallet

Sudden Oil Price Jump: Why Should You Care?Imagine filling up your car tank and noticing the price jump by 50 cents per liter overnight. That’s exactly what’s happening now, as geopolitical tensions in the Middle East cause oil prices to soar. Many Australian households feel the pinch...

Gold Price Trends & Trading Tips: Staying Ahead with XAUUSD

Understanding the Current Gold Market: What’s Happening with XAUUSDHave you ever felt overwhelmed trying to make sense of gold price movements? You're not alone. The recent pattern shows gold prices mostly trading within a range, with support around 5130 and resistance shifting slightly lower. This kind of...

Recent Market News & Insights You Can’t Miss – Stay Ahead in Trading

Hey Trader, Let’s Catch Up on Today’s Important Market News!Have you ever felt overwhelmed trying to keep up with rapid market changes and global headlines? Don’t worry—you’re not alone. Sometimes, a quick overview of recent events can give you that much-needed edge. Today, let’s walk through some...